
Page 26
Vektor™ Charts
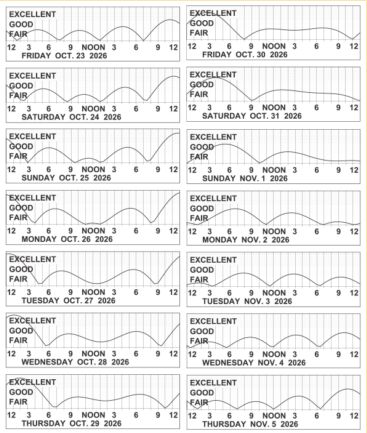
Vektor Charts
Each daily graph starts with midnight on the left. The Vector Fish & Game Activity Tables are computer-generated timetables indicating when fish, game and other species will tend to be in daily feeding and migration patterns. The tables, which indicate peak times, are based on the combined positions of the sun and the moon. Major periods can run from an hour before to an hour after the peak time; minor periods peak a half-hour either way.